The Farmer's Dashboard
The Farmer's Dashboard is a farming tool that provides daily automated insights about your crops. It helps with mapping of crop bed, the location, and identification of individual plants, and the extraction of their growth curves from the collected data. It is a set of hardware and software tools for affordable, customisable, and high frequency crop monitoring.
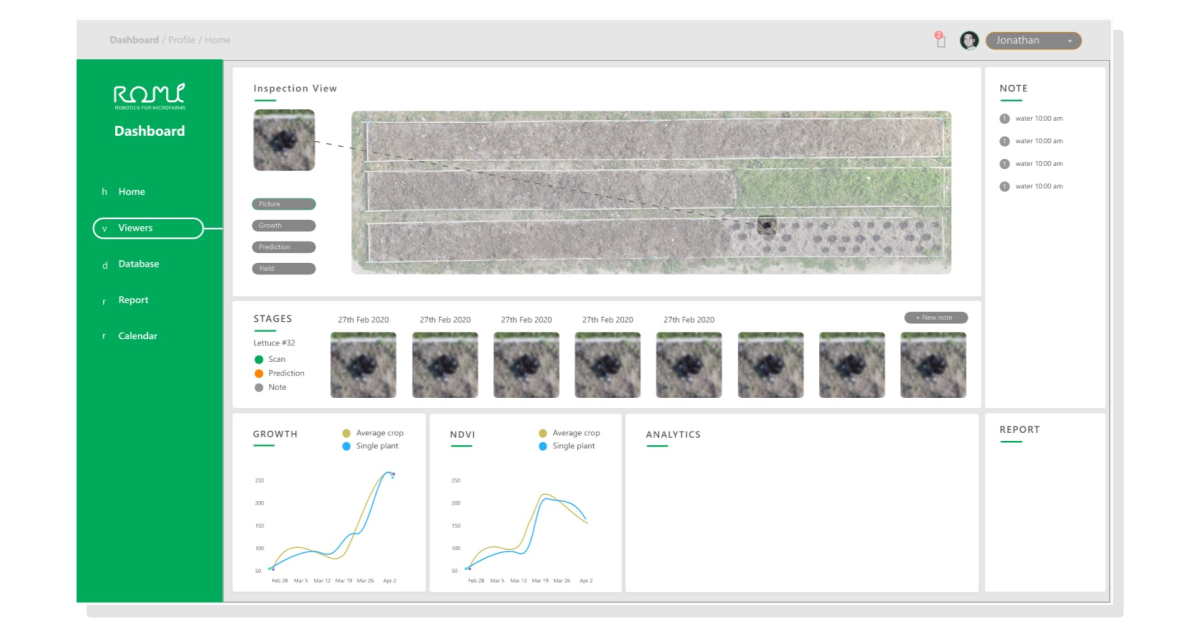
The dashboard supports farmers with imaging and analytics that identify and track plant growth.
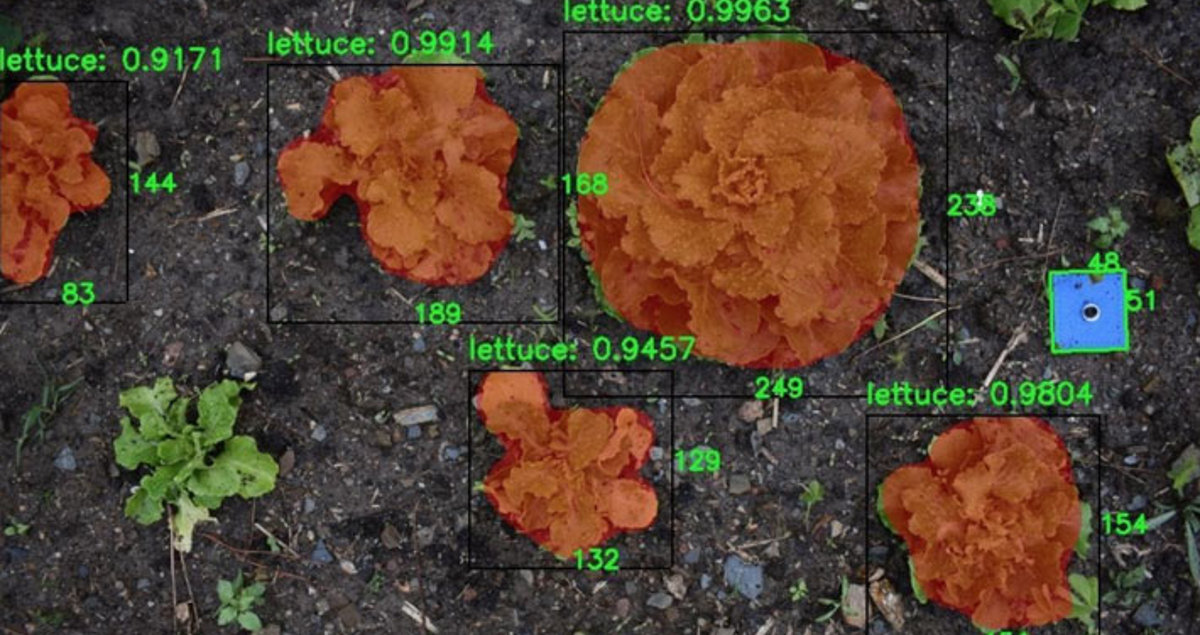
After plants are detected, a catalogue of individual plants is created. By comparing them with historical data, we can obtain plant growth curves. All of the information is then combined into a weed map which is made available on the Farmers Dashboard website.
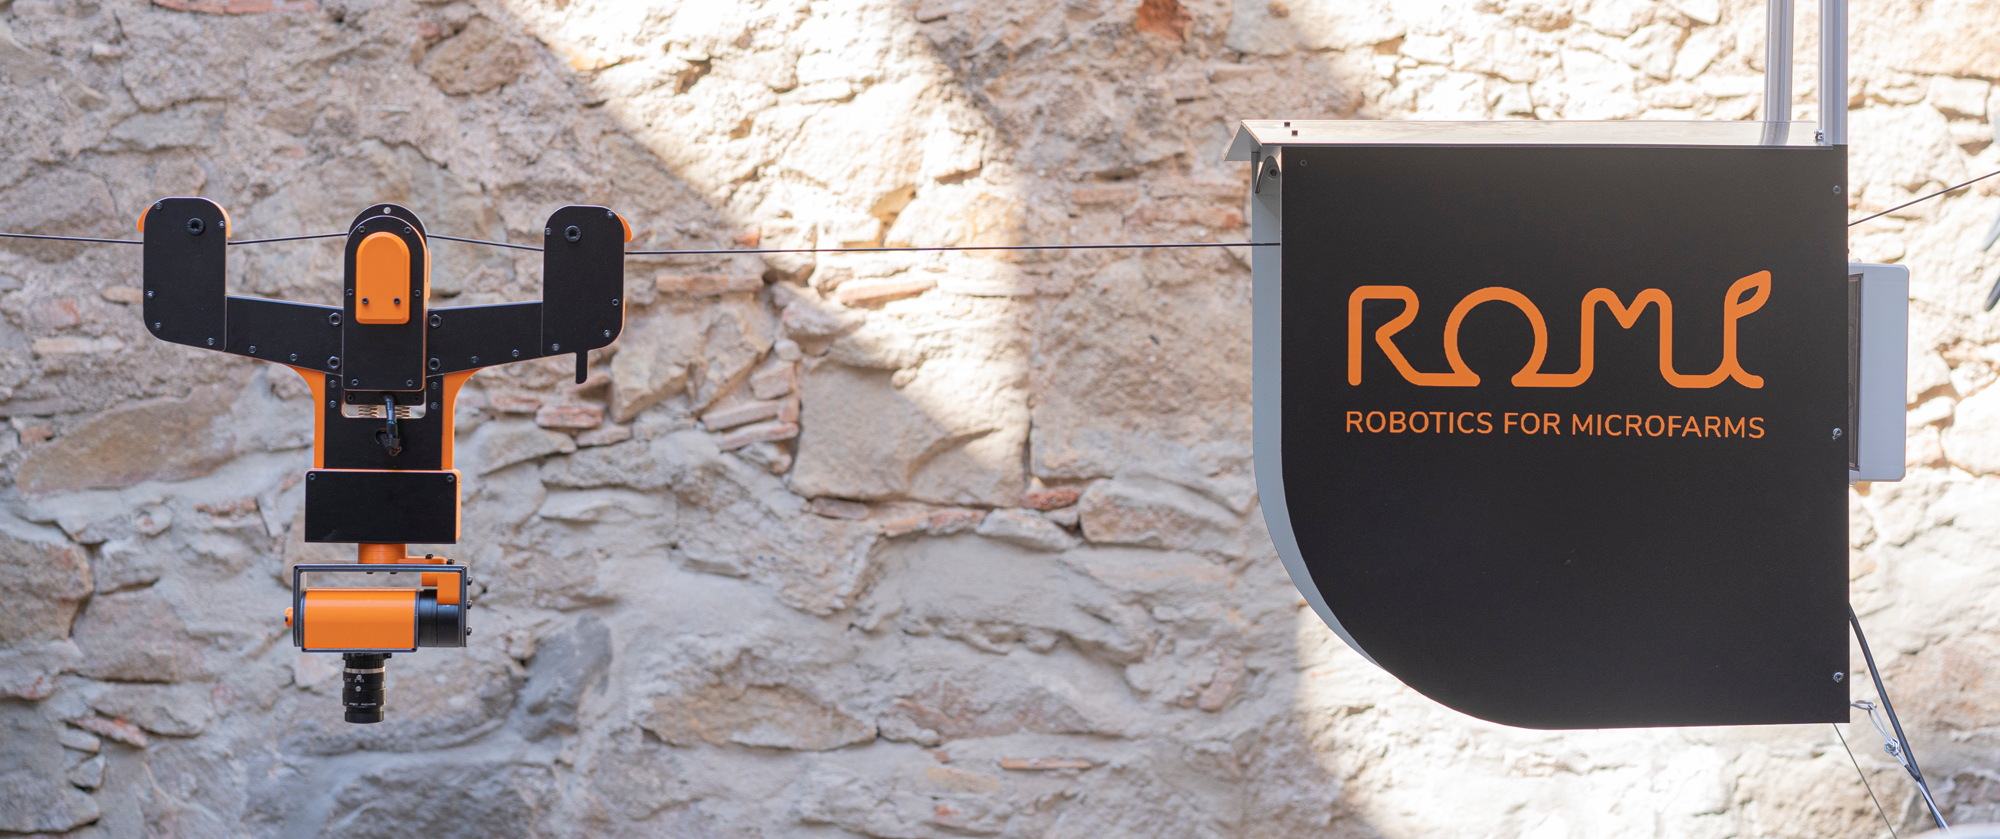
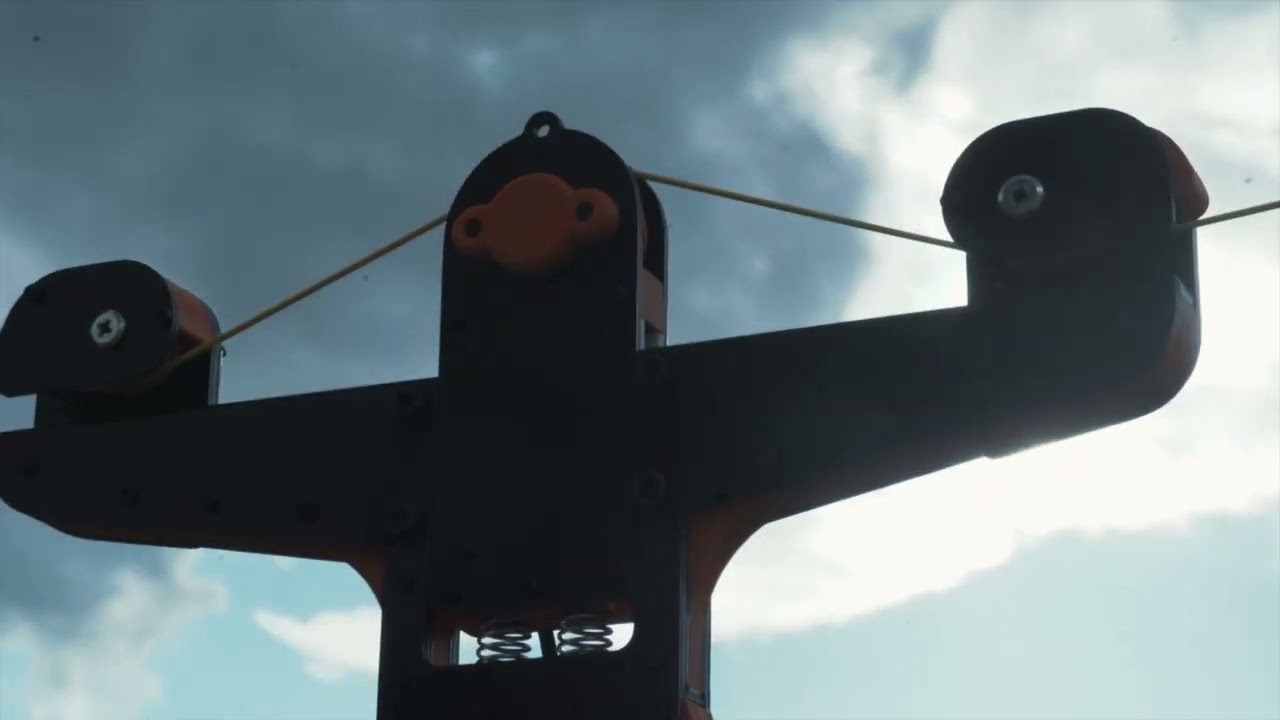
Image data may be recieved from multiple sources, including drones, the rover, and cable bots. ROMI's Cable Bot is adapted for use in greenhouses, and polytunnels, and in situations where the use of a drone is not adapated.
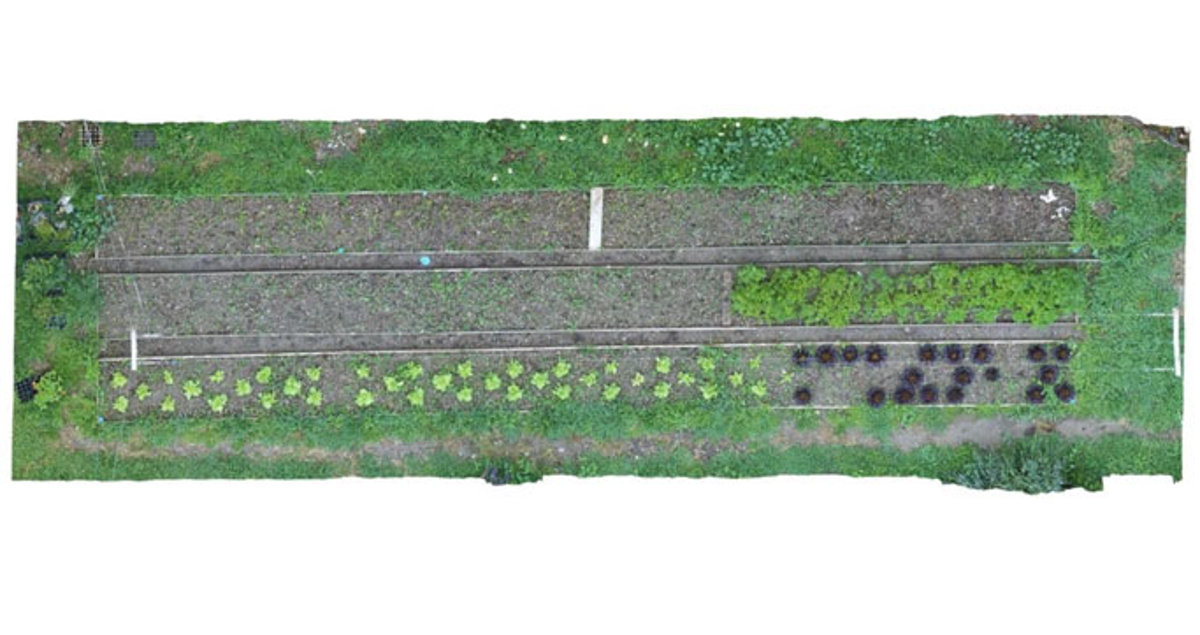
Once set up, the ROMI Cable Bot will move multiple times a day across the crop bed, taking high definition images and sending them to a ROMI server. The images are assembled into a unique portrait of your crop bed.